Rank tracker
Track your Google Maps rankings over time
Read the history of a recurring scan: every keyword run by run in Rankings, one keyword's line in Trend, and two dates side by side in Compare, with CSV, PDF and PNG exports.
Updated October 5, 2026 · 6 min read
A recurring scan builds a history of your Google Maps rankings, one run at a time. Its report has four views to read that history: Overview (the map of any single run), Rankings (every keyword, run by run), Trend (one keyword over time) and Compare (two dates side by side).
The screenshots use a made-up plumber called Your Business in Austin, TX, with a weekly recurring scan of three keywords that has run 8 times.
- Where
- The report of any recurring scan, from Recurring scans or Scan history.
- Who
- Every plan. You need at least two runs of a recurring scan to see a change.
- Cost
- Free. These views only read scans you already ran.
Open a recurring scan's report
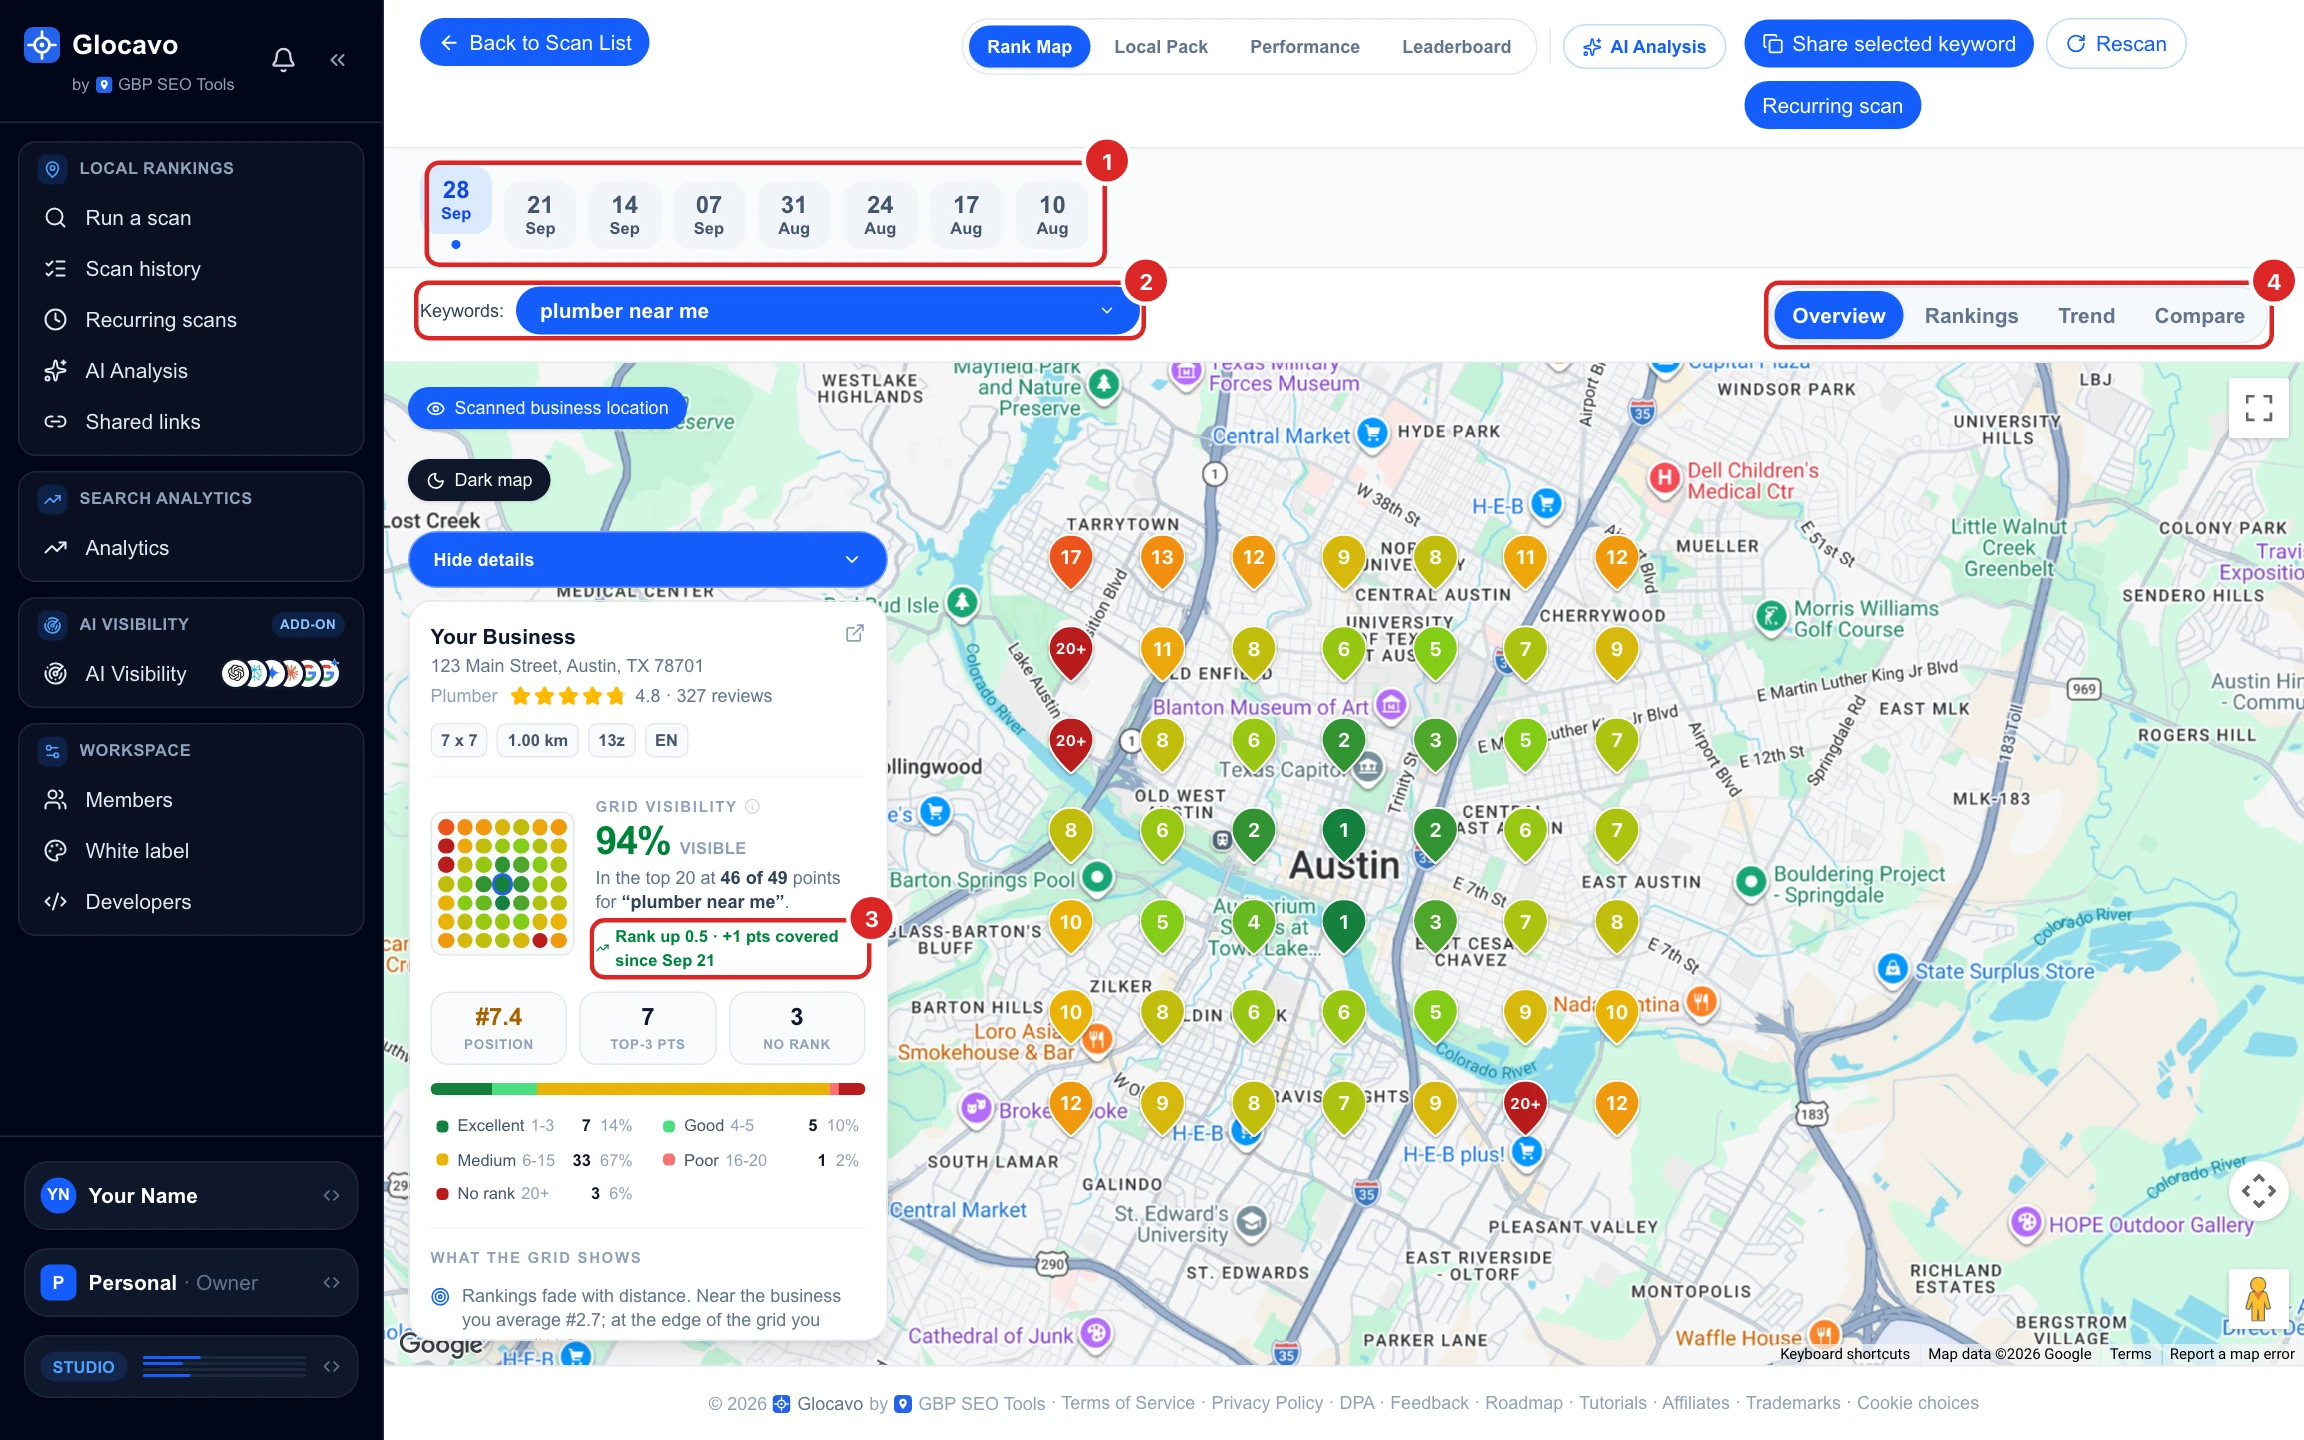
On Recurring scans, click the eye on a card, or open any of its runs from Scan history. The report opens on the latest run. On top of a normal report you get:
- The dates of every run. Click one to see the map from that day.
- Keywords: switch to another keyword of the same recurring scan.
- The change since the run before, under Grid visibility: here Rank up 0.5 and one more point in the top 20 since Sep 21.
- Overview, Rankings, Trend, Compare: the four views of this guide.
For a one-time scan these views don’t appear. Turn it into a recurring scan with the Recurring scan button at the top of its report, see recurring scans.
See every keyword in Rankings
Rankings lists every keyword of the recurring scan with its average rank on each run. Lower is better, #1 is the top.
- The period: the last 7 days, 28 days, 3 months, or pick a start date.
- Movement: the change since the run before, blue when you moved up, red when you dropped.
- History: a small line of every run in the period.
- One column per run, oldest on the left. Scroll the table sideways to see them all.
- Export CSV downloads the table for a spreadsheet or a client report.
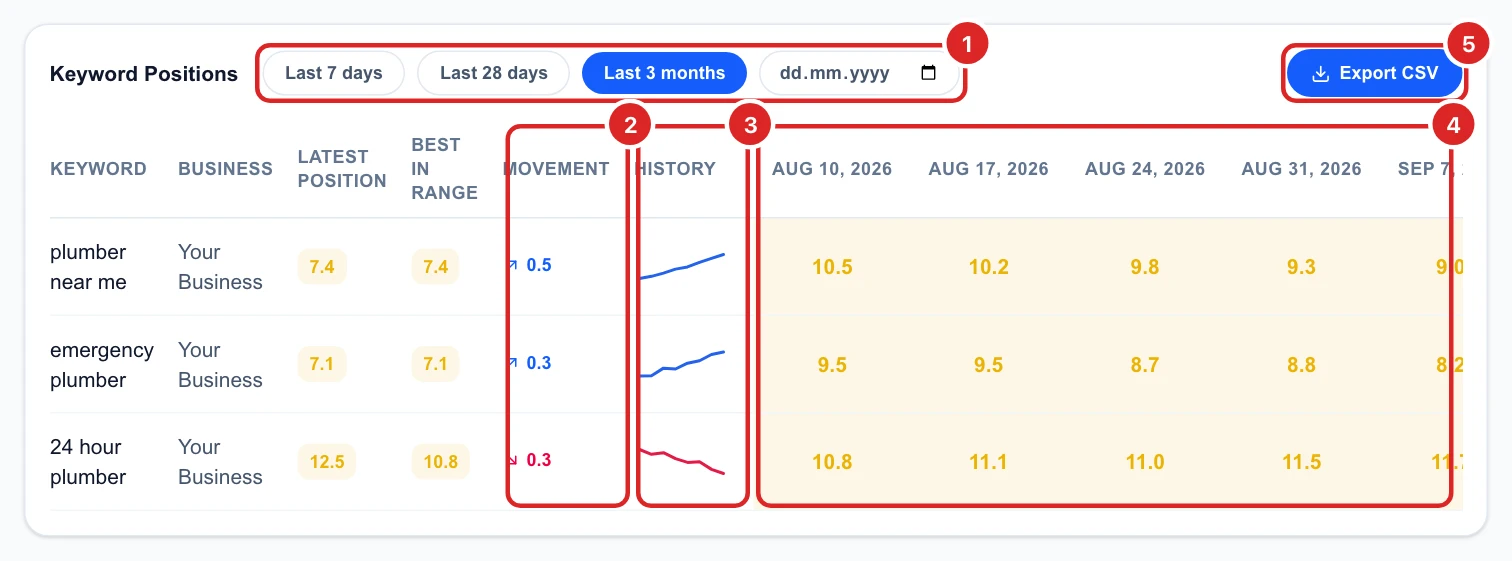
Here 24 hour plumber is slowly slipping while the other two climb: the kind of thing you only see over several runs. Open that keyword’s map to see where you lose ground.
Follow one keyword in Trend
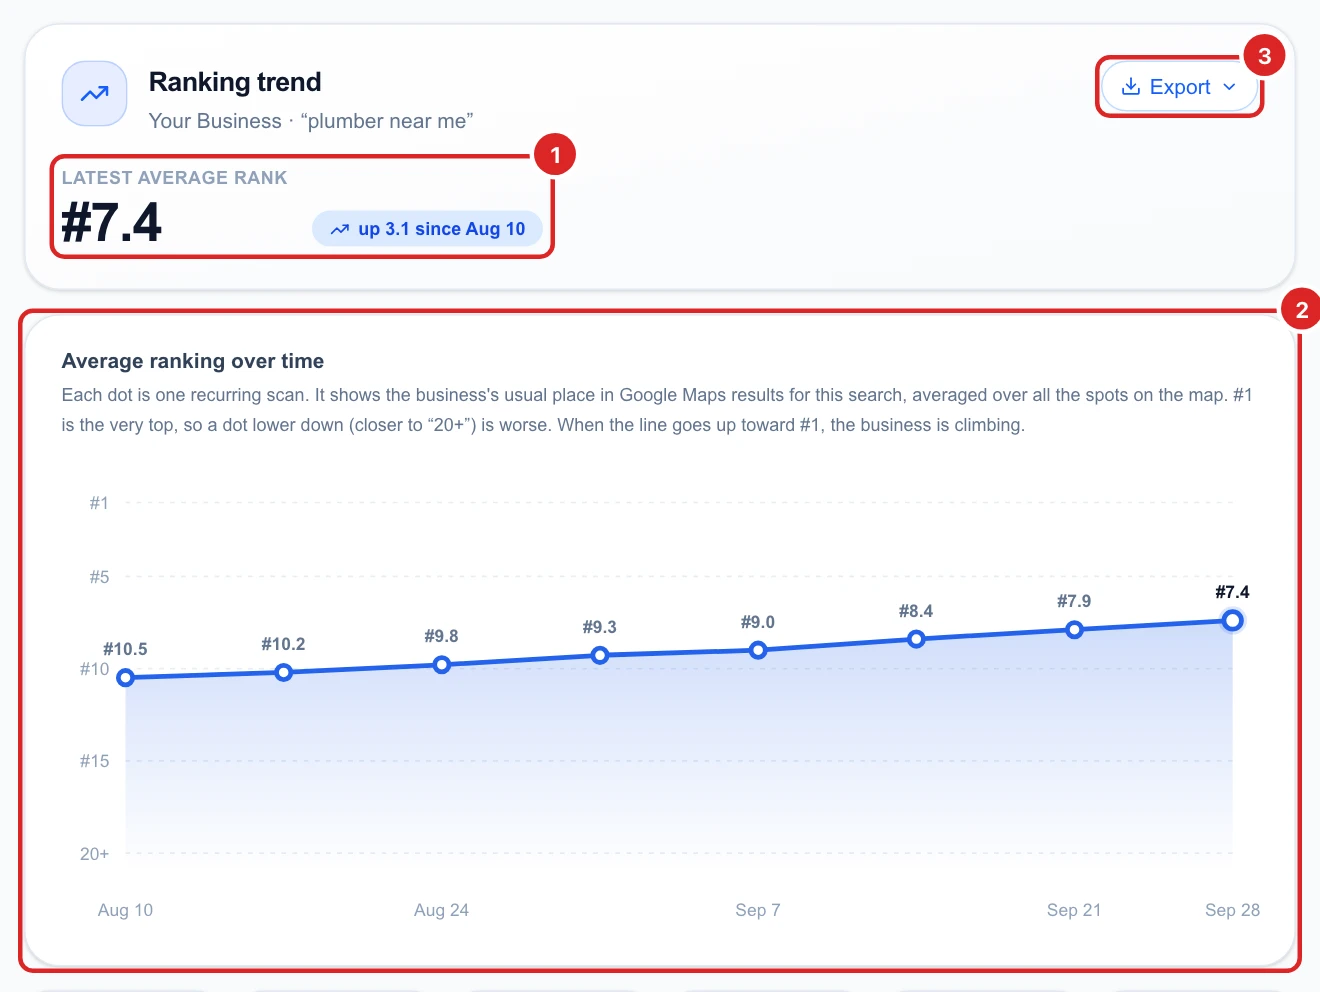
Trend shows the keyword you picked over time: your latest average rank, how much it moved since the first run, and a chart with one dot per run. When the line goes up toward #1, you are climbing. Export saves the view as a PDF or a PNG image.
Check the numbers behind the trend
Under the chart, six tiles sum up the period: your best, worst and average rank, the latest one, how many scans and over how many days. Below them, every run with its average rank and how many places it moved since the run before.
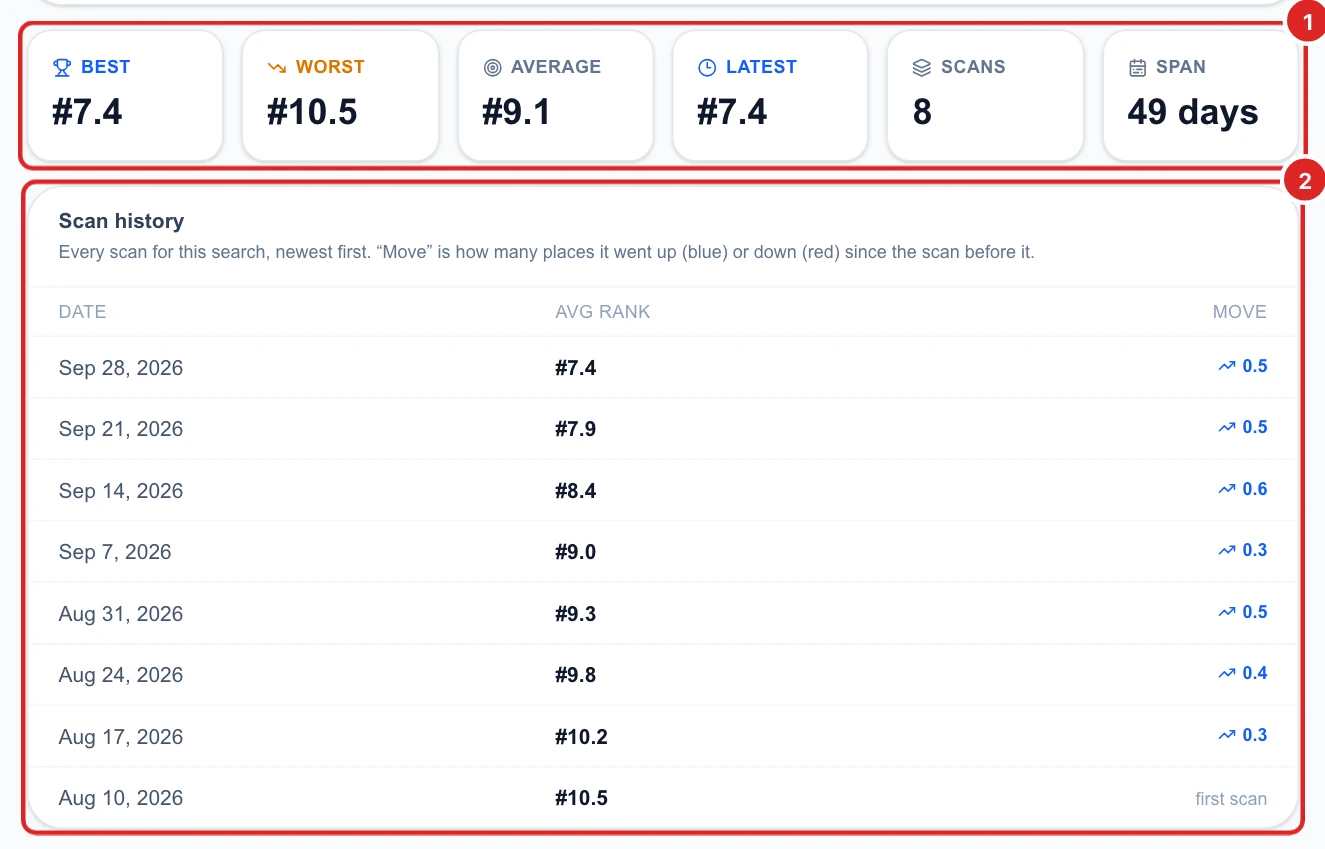
A move of a few tenths from one run to the next is normal: Google Maps results shift a little every day. Look at the direction over several runs, not at one week.
Pick two dates in Compare
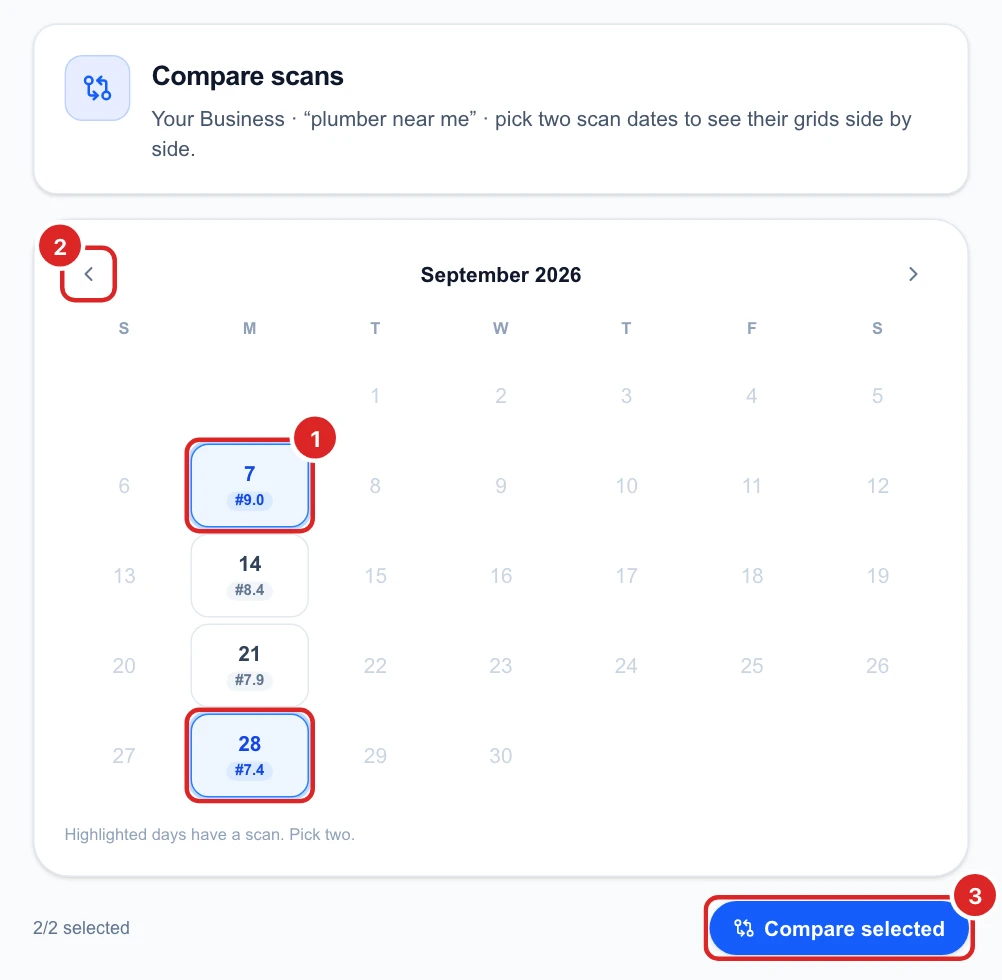
Compare puts two runs side by side, for example before and after you worked on your Google Business Profile. In the calendar, the days with a run are highlighted with their average rank. Click two of them (use the arrows for other months), then Compare selected.
Read the before and after
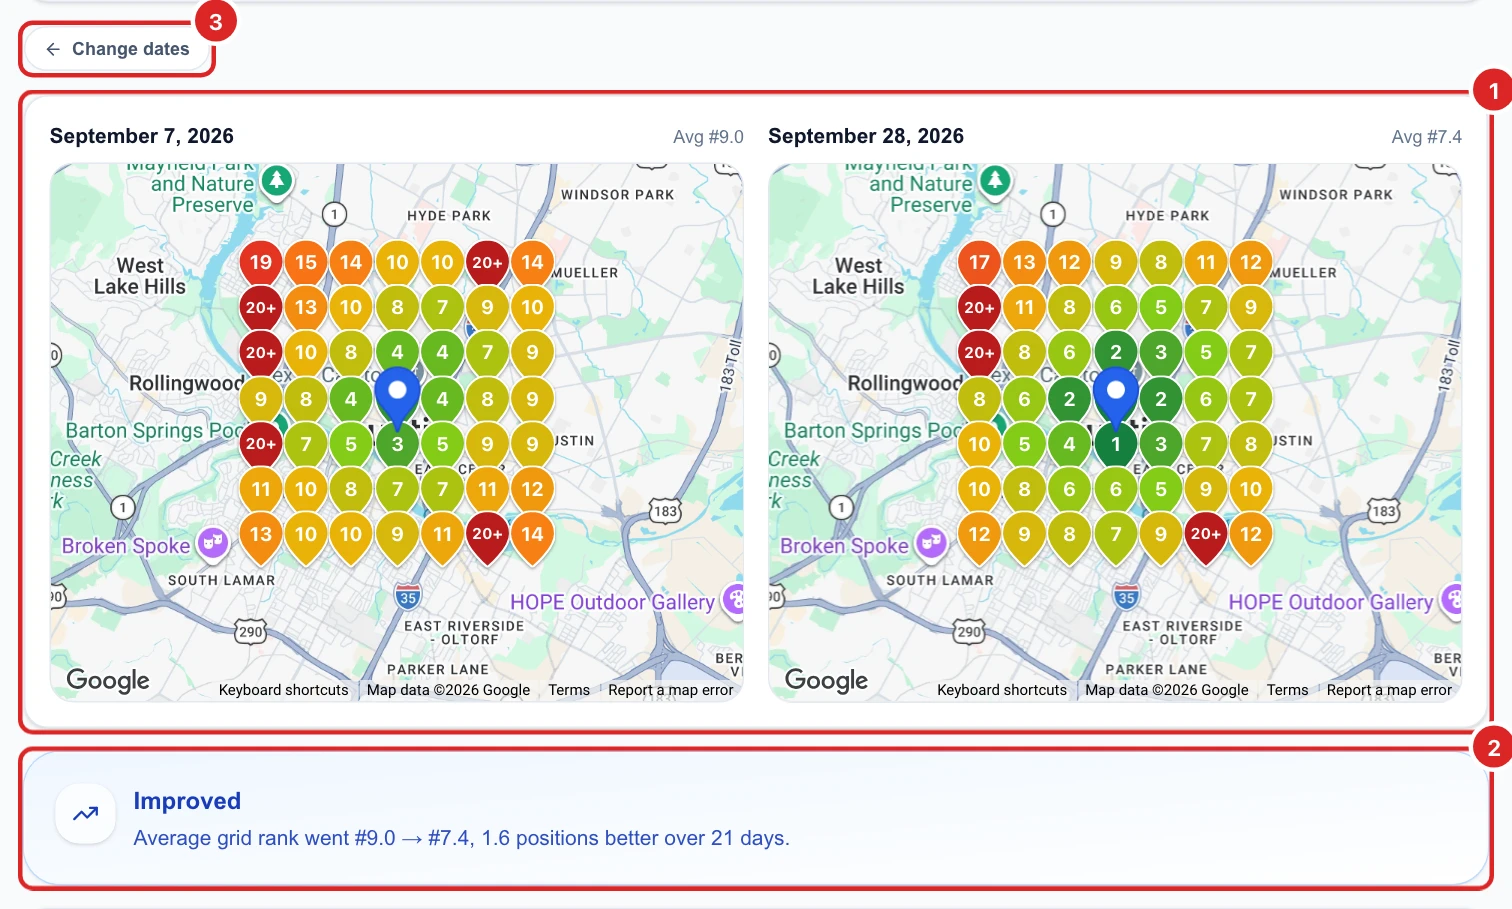
The two maps show your rank at every point on each date, with the older one on the left. Underneath, a one-line verdict sums it up: here Improved, from #9.0 to #7.4 in 21 days. Click Change dates to pick two others.
Further down:
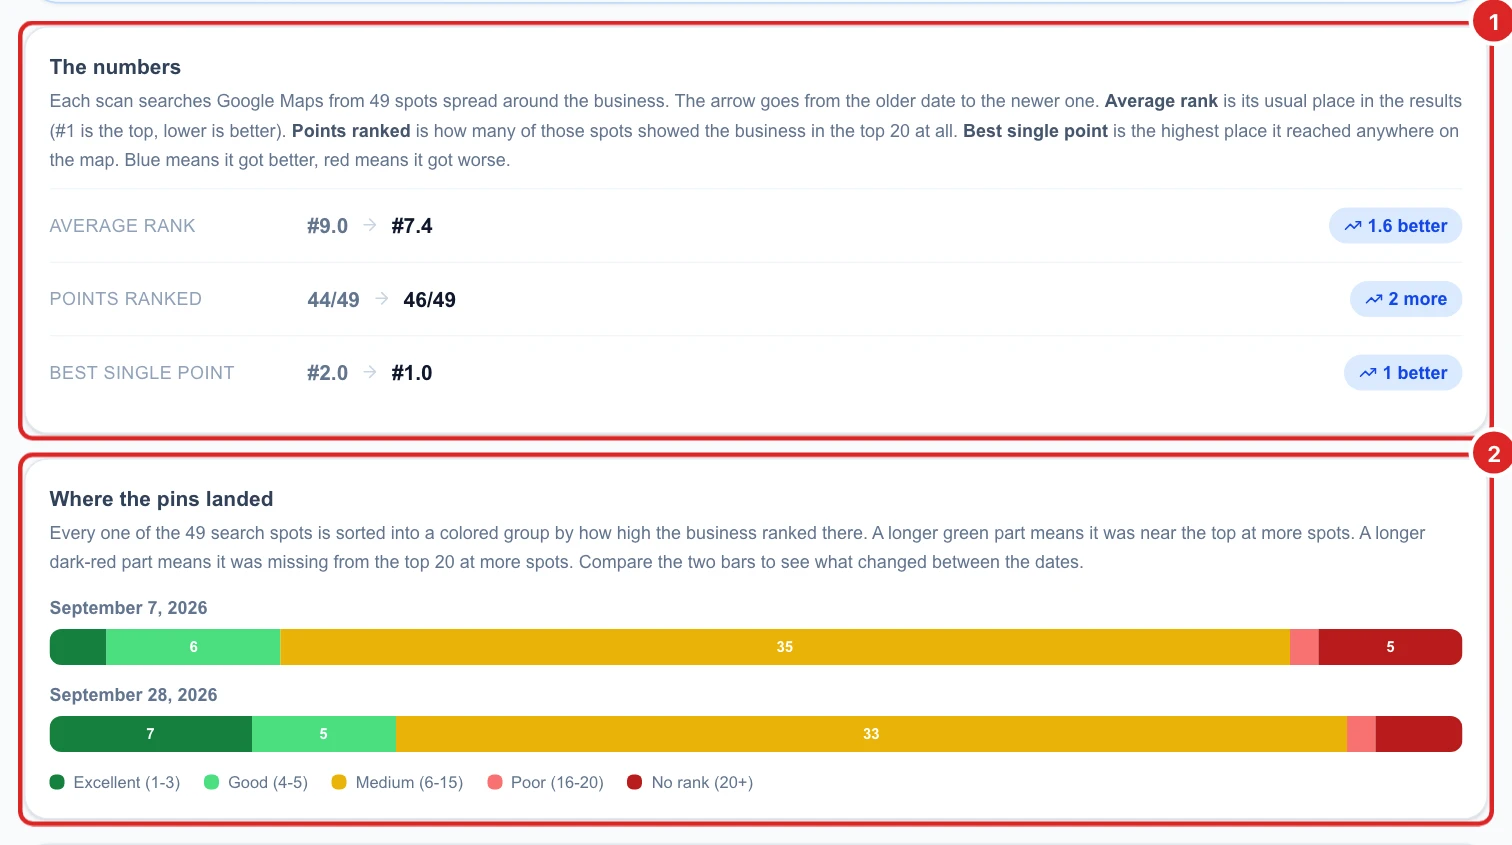
- The numbers: your average rank, how many points you ranked in the top 20 and your best single point, on each date, and how much each one changed.
- Where the pins landed: every point of each map grouped from Excellent (1 to 3) to No rank (20+). A longer dark green part means more points in the map pack.
The last line shows the grid of both runs. If you changed the recurring scan’s grid size in between, each date shows its own: compare the average rank then, not the maps point by point.
See several recurring scans at once
Rankings inside a report covers one recurring scan. To see the keywords of several at once, for example every location of a business, go to Recurring scans, tick their cards and click Positions. It opens the same table, with one row per keyword of every recurring scan you picked.
Decide what to do next
- Check Rankings once a week or once a month. A red Movement on the same keyword two runs in a row is worth a look.
- Before a big change to your Google Business Profile (new categories, services, a review push), note the date. A few weeks later, use Compare on the runs before and after it.
- When a keyword slips, open that run’s map and check the Leaderboard to see who took your place.
- To show a client the progress, export the Trend view as a PDF or the Rankings table as a CSV.