Rank tracker
Get an AI analysis of your Google Maps rankings
Generate the AI Analysis of a grid scan and read its seven parts: visibility score, distance decay, competitor takeover, blind spots, keyword diagnostic, quick-win action plan and growth potential.
Updated October 3, 2026 · 7 min read
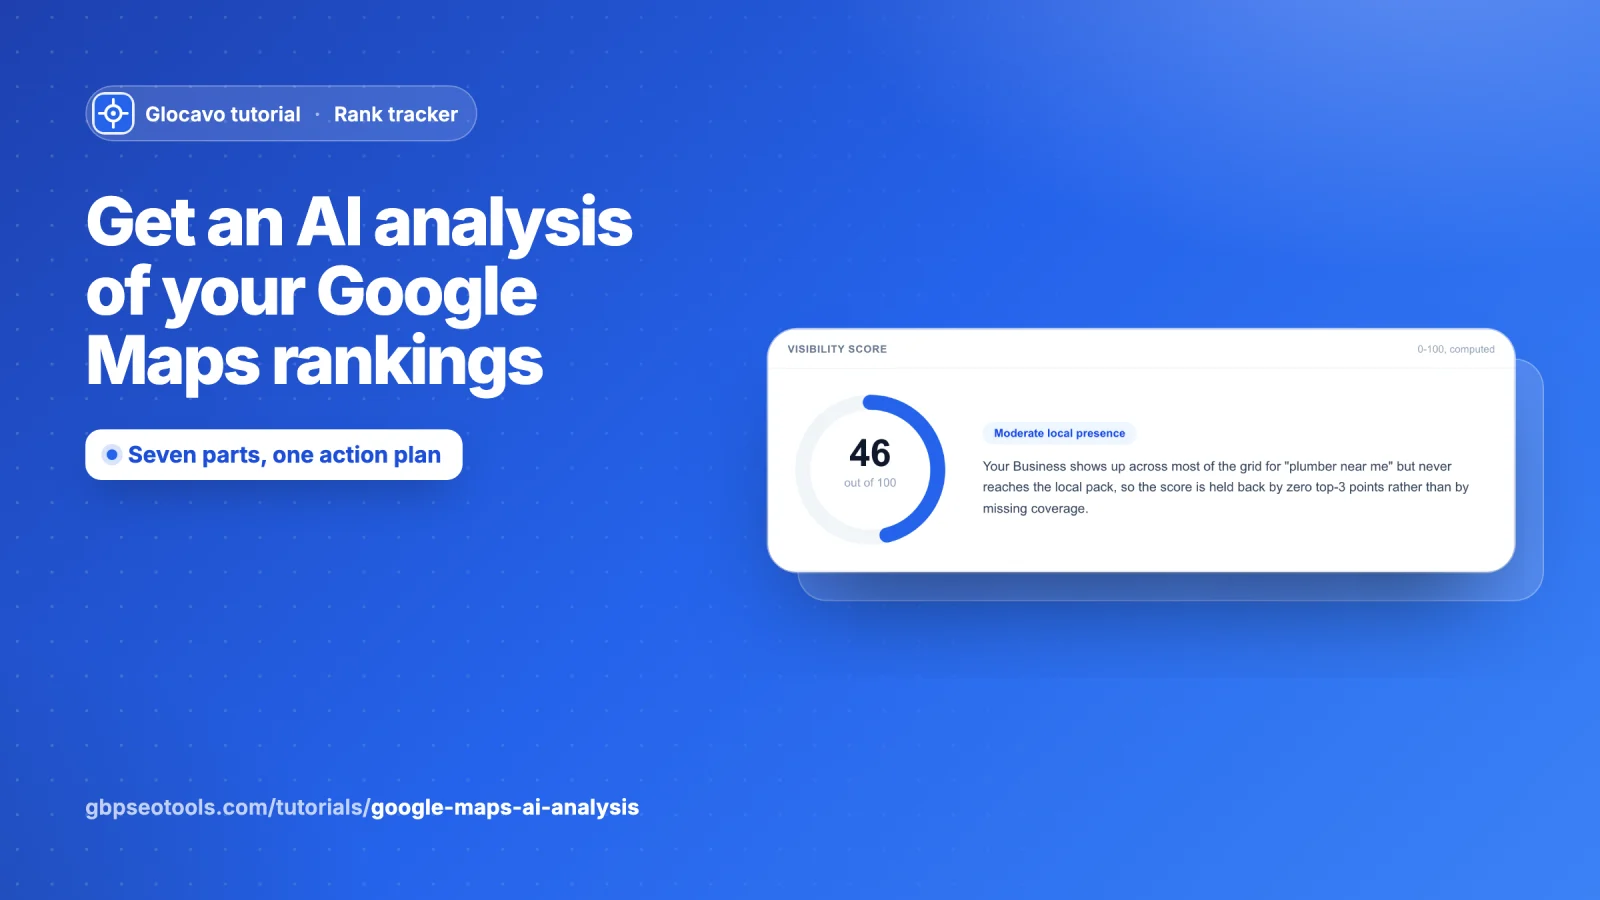
AI Analysis turns a grid scan into a written report in seven parts: your visibility score, how your ranking fades with distance, which competitors take your lost points, where your easiest wins are, how well your listing fits the keyword, a step-by-step action plan and what moving up could be worth. The numbers are calculated from your scan; the AI writes the explanation and the advice around them.
The screenshots use a made-up plumber called Your Business in Austin, TX, scanned on a 7x7 grid for plumber near me. Your report is written for your own business and scan.
- Where
- Any finished scan → the AI Analysis tab.
- Who
- Every plan, Free included. Free's 50 AI Power covers two analyses.
- Cost
- 25 AI Power each time you generate or regenerate an analysis. Opening a saved analysis is free.
Generate the analysis
In a scan report, click the AI Analysis tab, then Generate AI Analysis. It uses 25 AI Power. The analysis is saved with the scan, so it’s there the next time you open it at no extra cost.
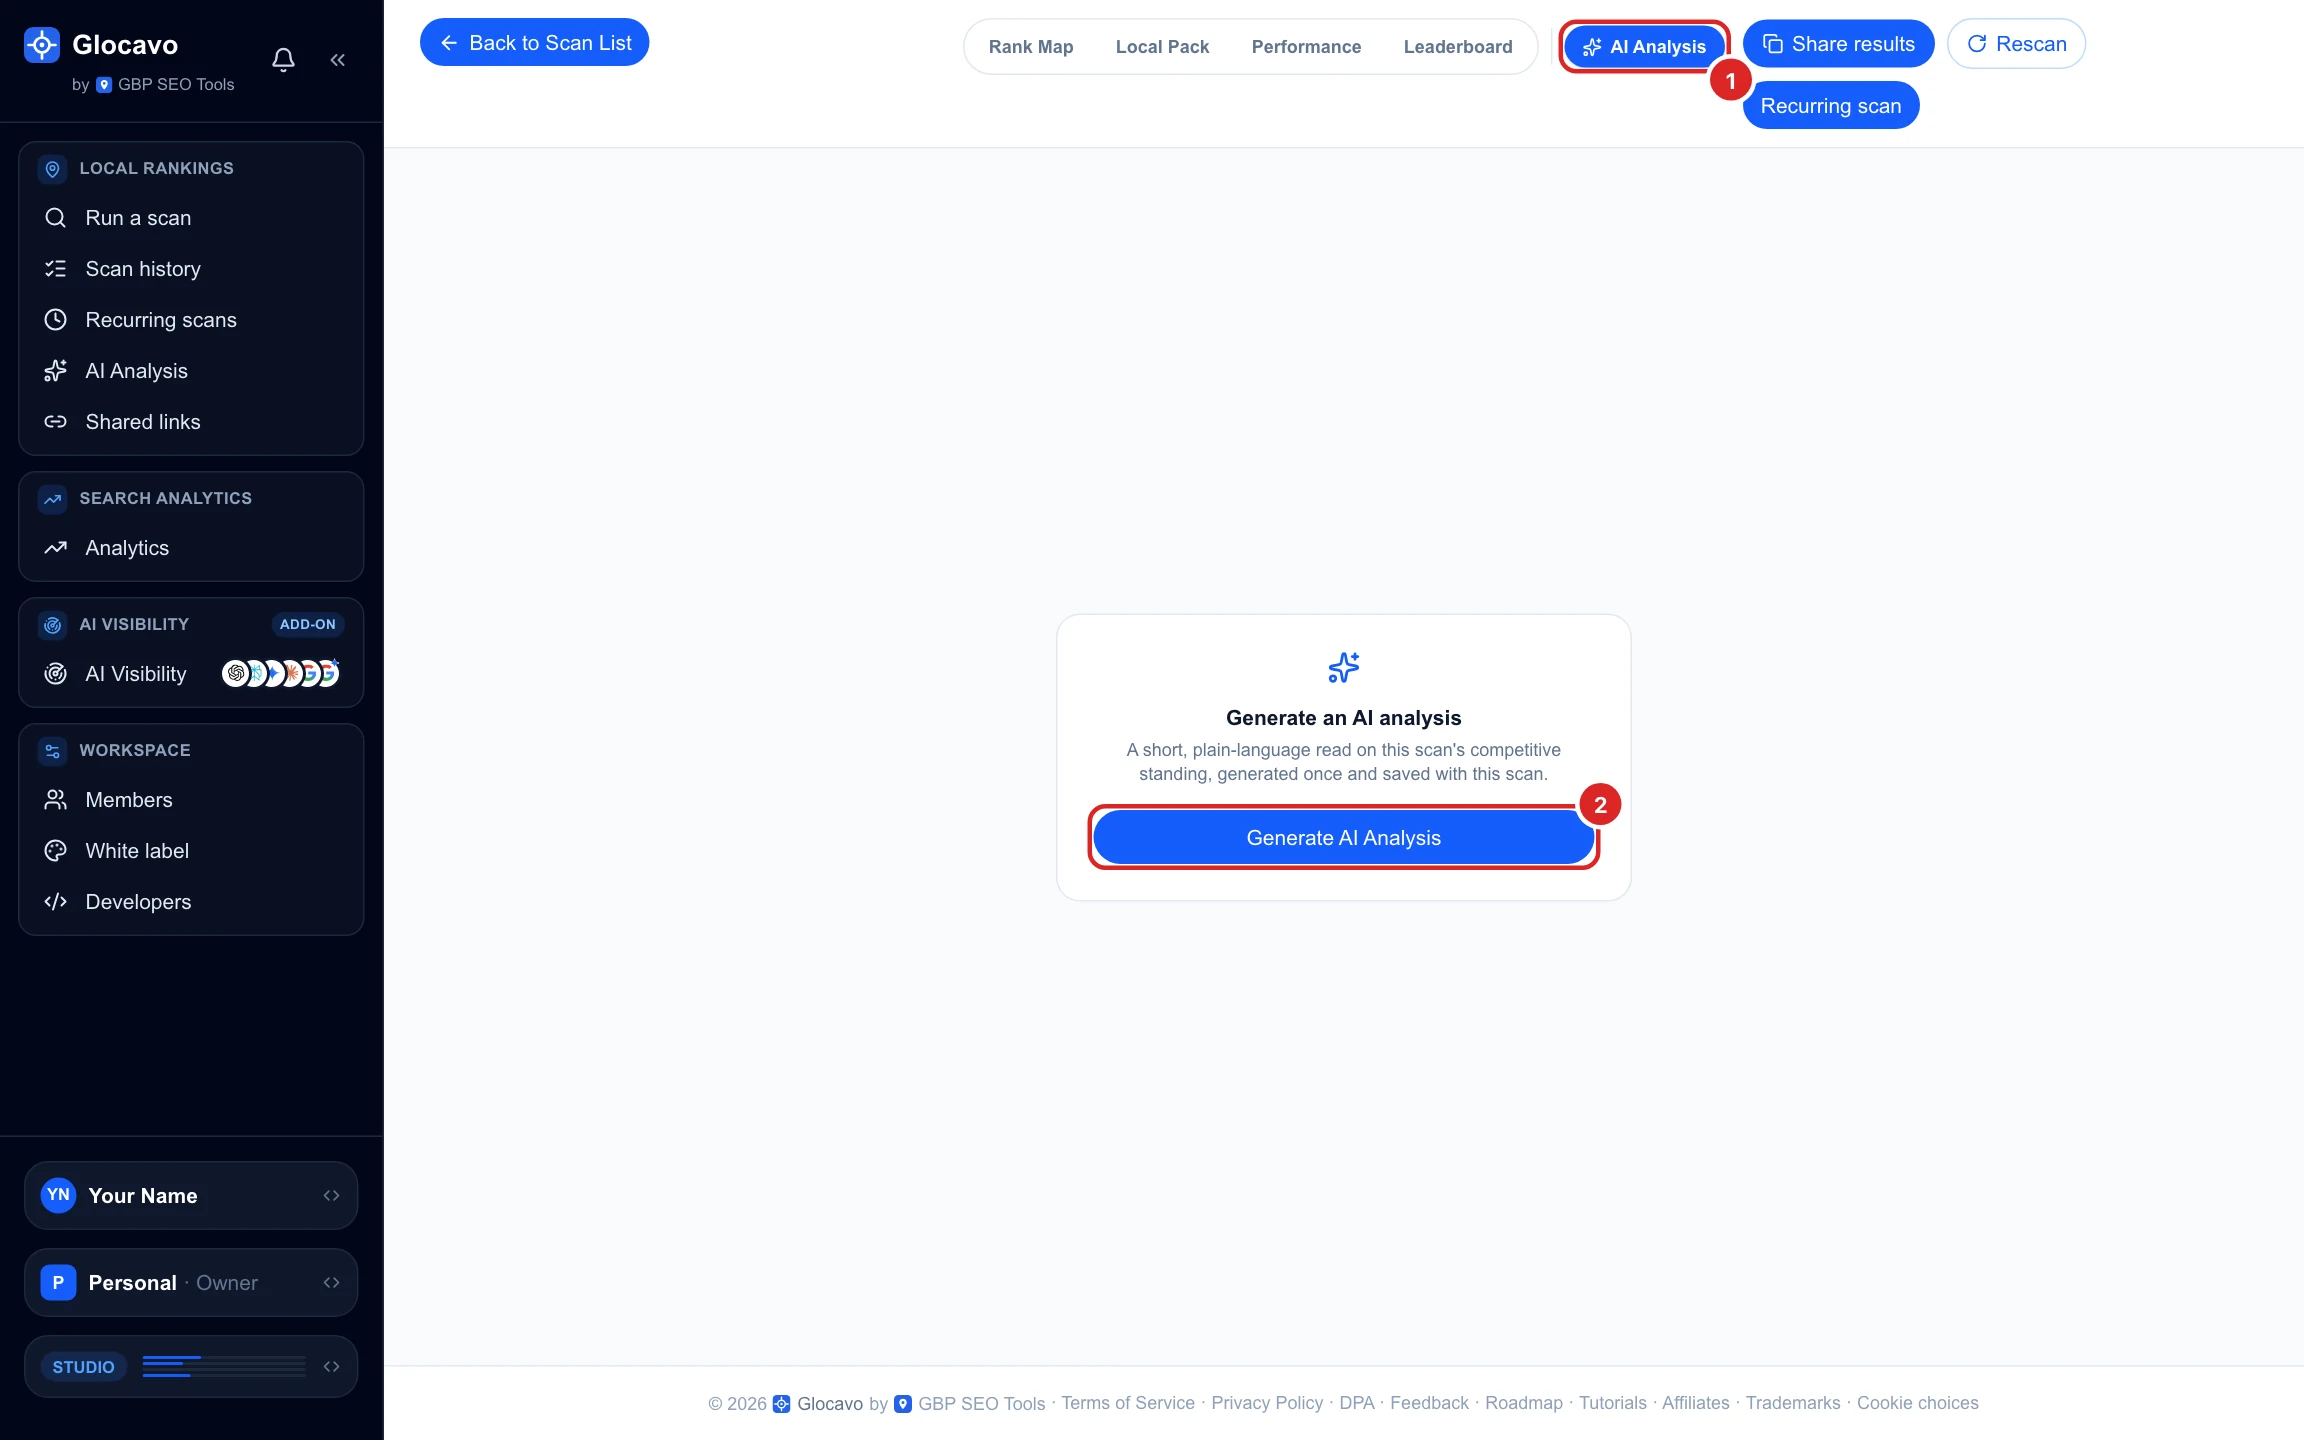
Each analysis covers one keyword. With several keywords in a scan, switch keyword in the Keywords menu and generate one for each you care about.
Read your visibility score
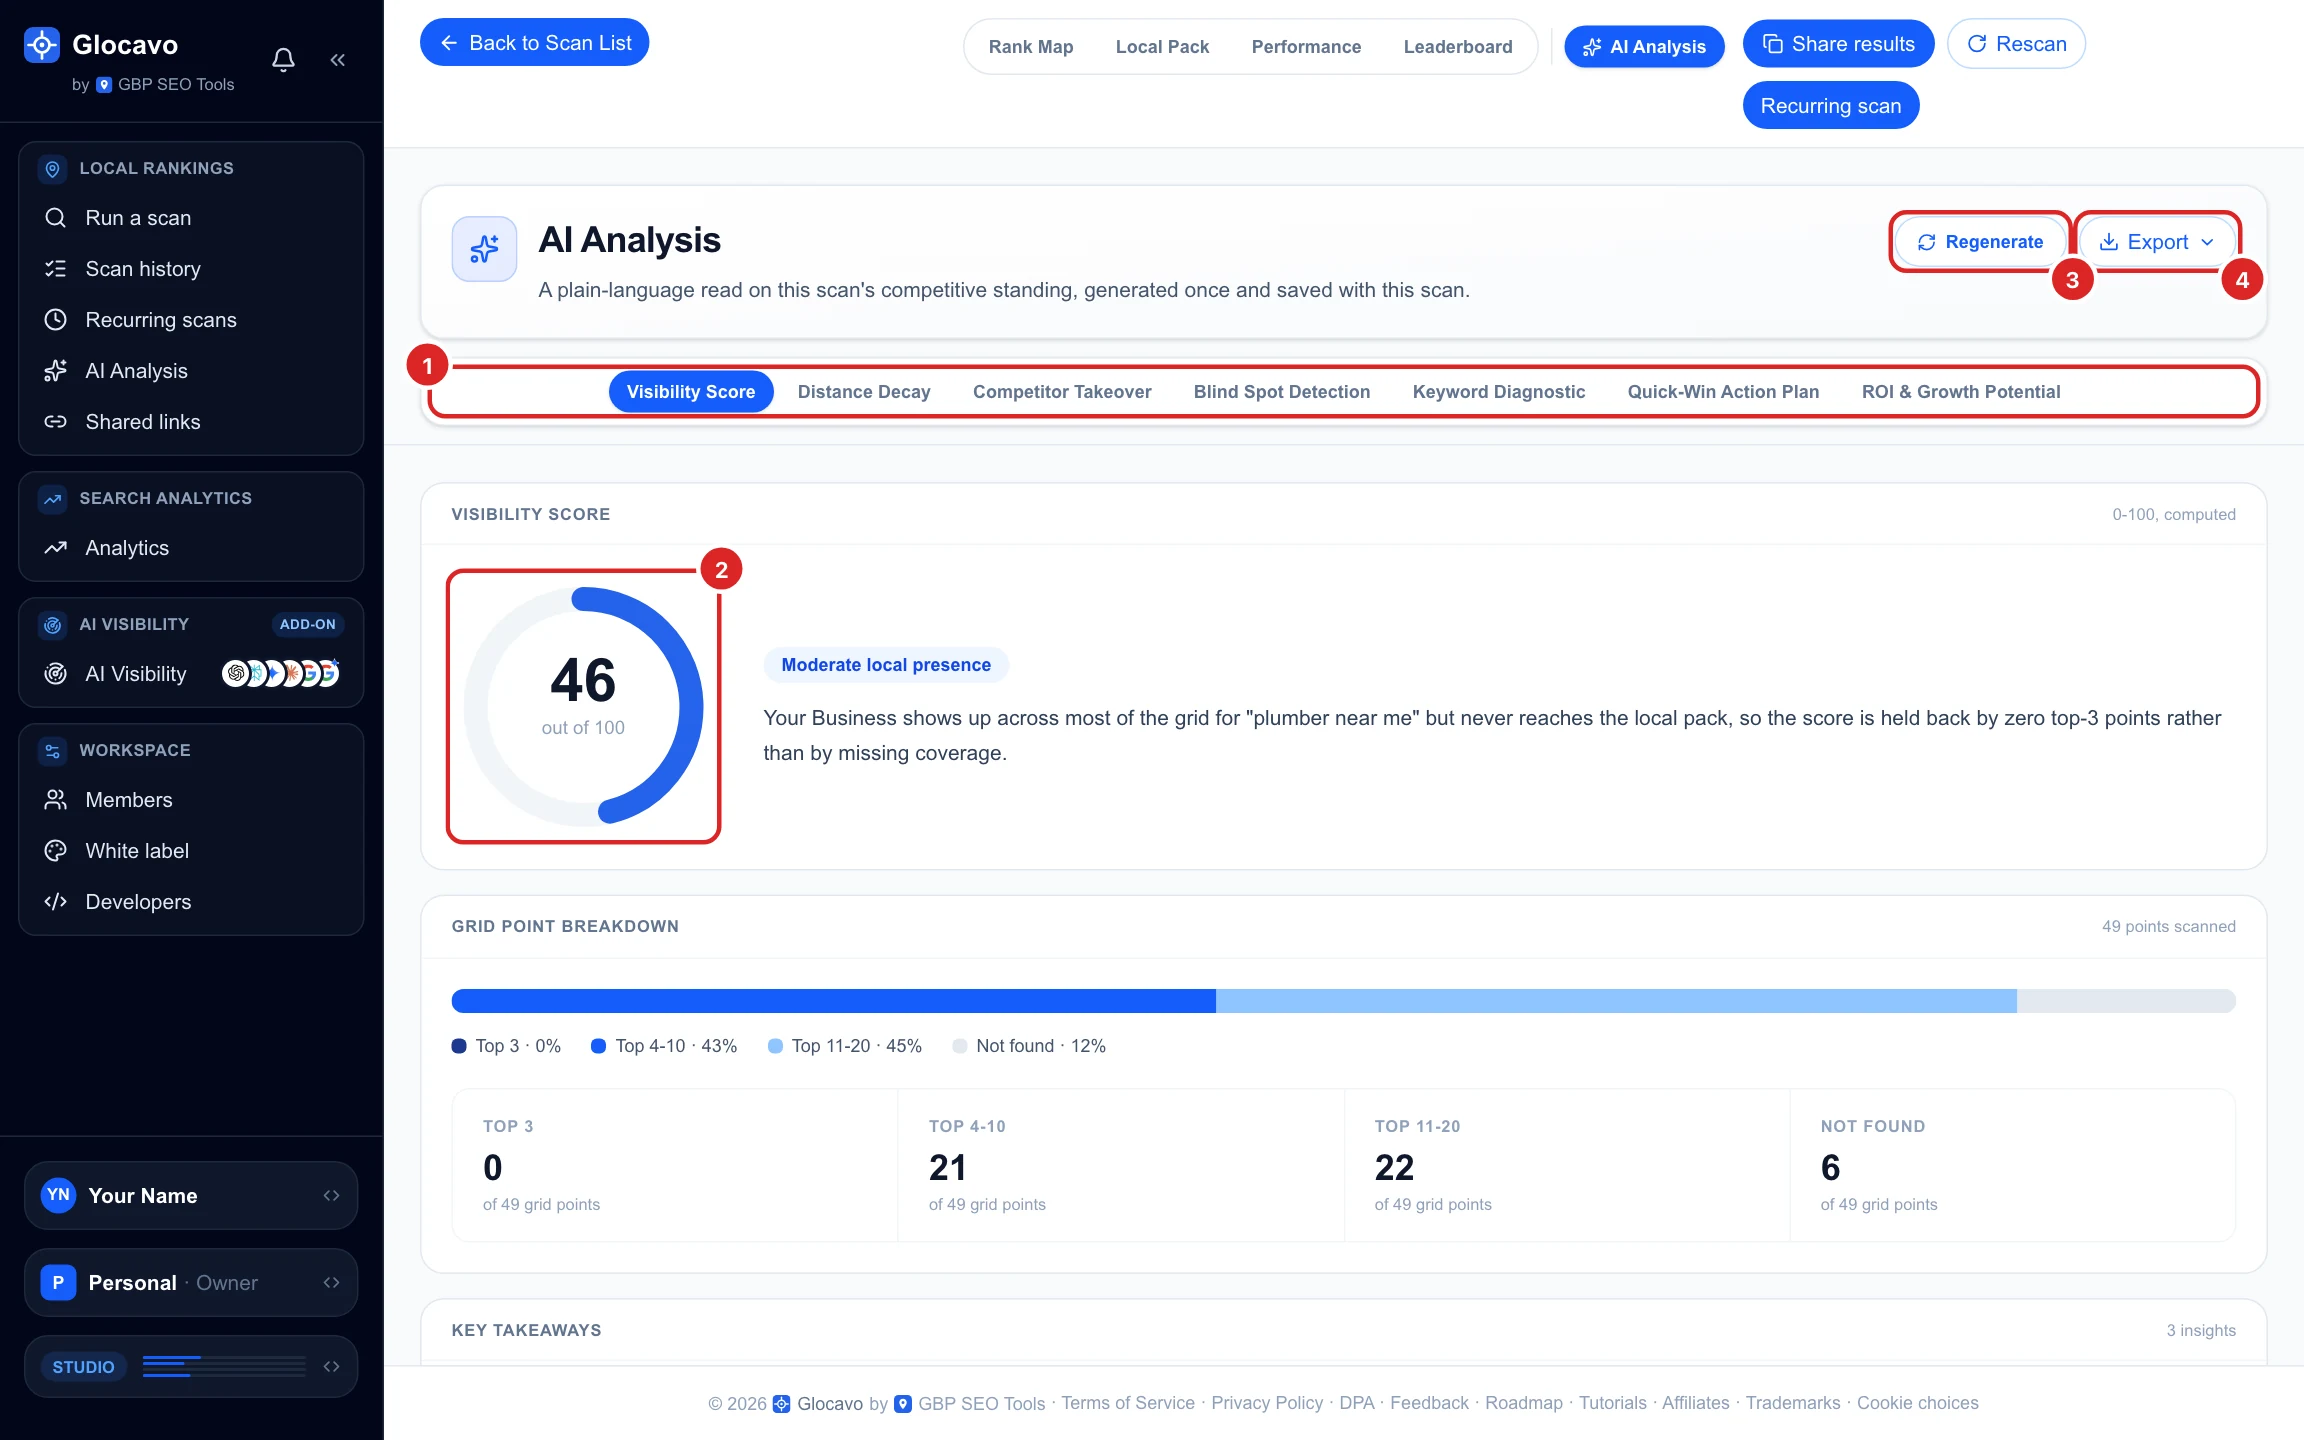
The report opens on Visibility Score, a number from 0 to 100 calculated from your scan: how often you show up in the top 20, how often in the top 3, and how high you rank on average. Here it is 46, moderate local presence. Under it:
- A one-sentence read of the score.
- Grid point breakdown: the share of points in the top 3, 4 to 10, 11 to 20 and not found.
- Key takeaways: three short insights, for example that 21 points already sit in positions 4 to 10, the cheapest band to push into the map pack.
The menu on the left opens the other six parts. Regenerate writes a fresh analysis (25 AI Power again) and Export downloads it.
See how your ranking fades with distance
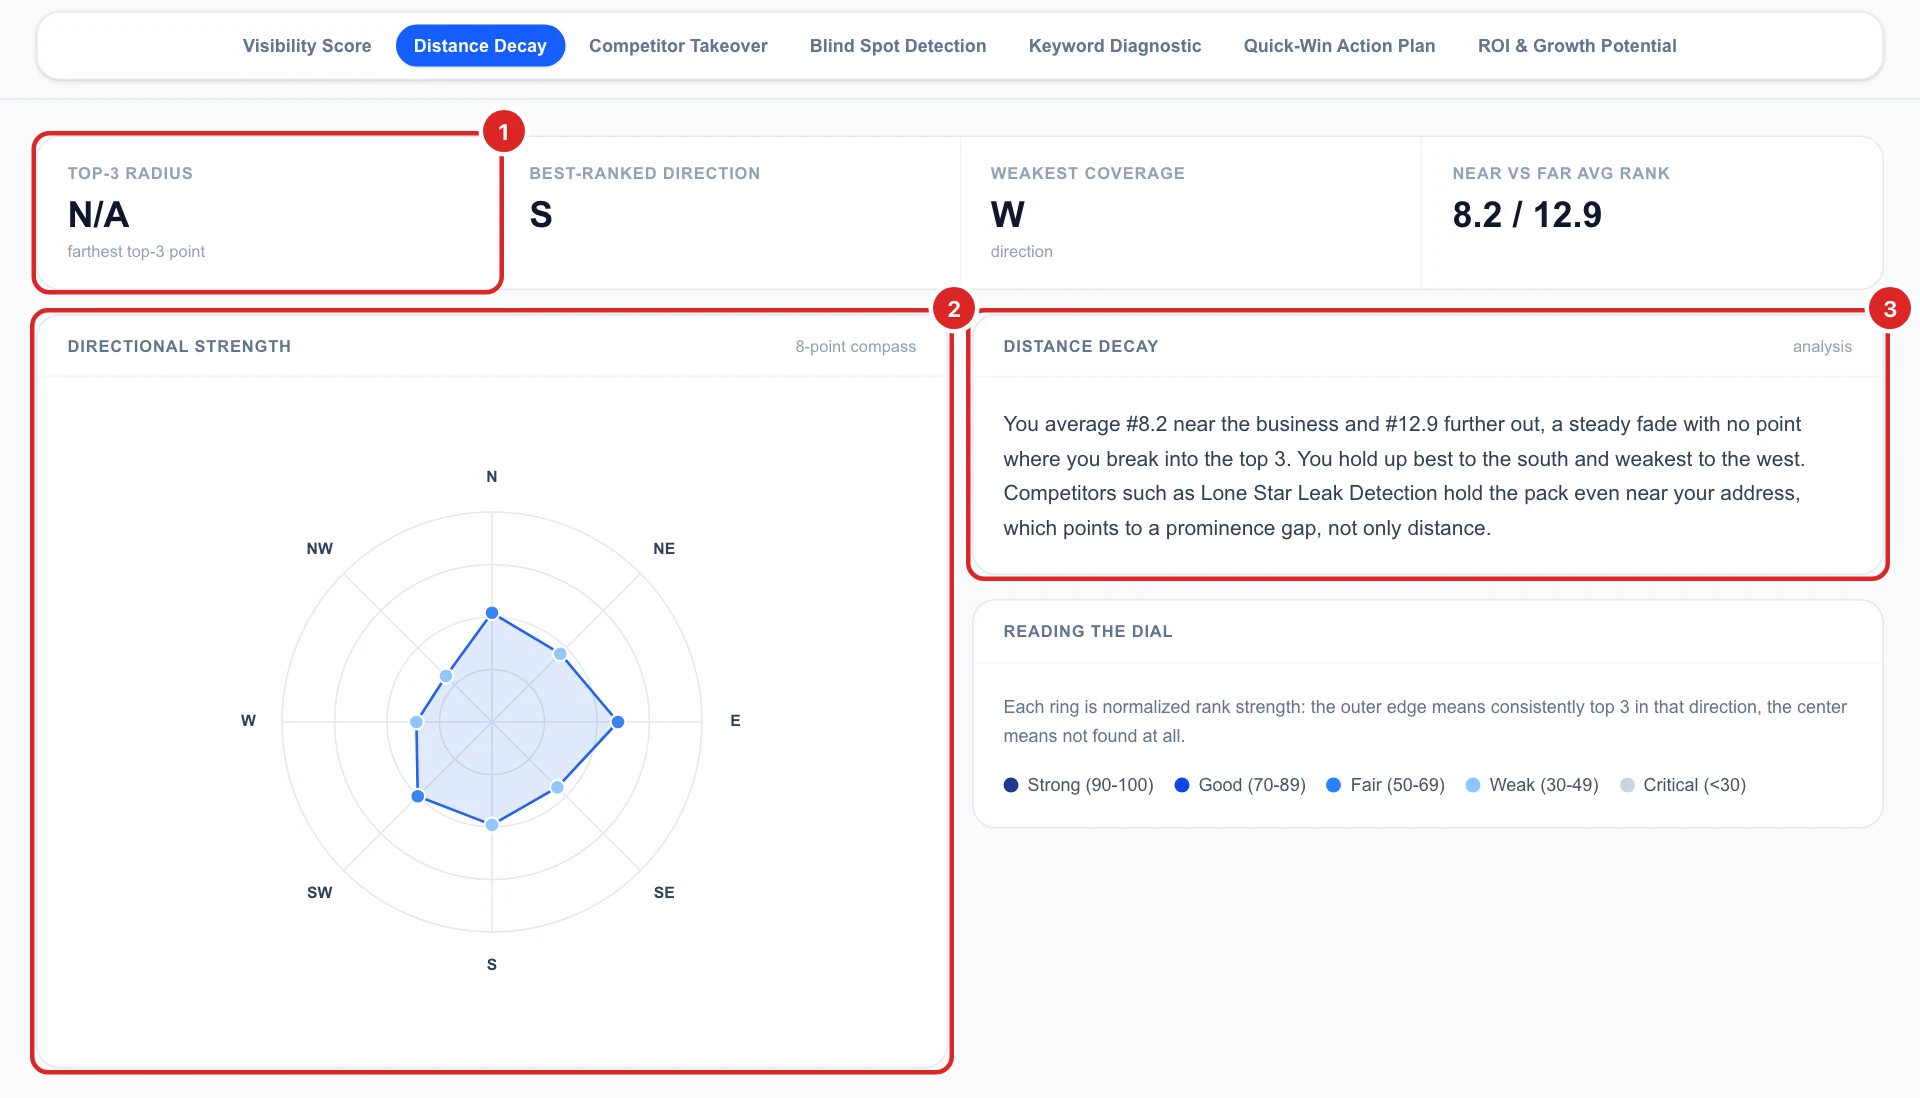
Distance Decay shows how far from your business you hold up:
- Top-3 radius: the farthest point where you are in the top 3 (N/A when you never are), plus your best and weakest direction and your average rank near the business against further out.
- Directional strength: a compass dial with eight directions. The further a direction reaches toward the outer ring, the stronger you rank that way.
- Distance decay analysis: what the pattern means, in plain words.
Find out who takes your lost points
Competitor Takeover looks at every point where you are not in the top 3 and names the two competitors that take those spots most often. Each card shows the threat level, its share of your lost points, how many more (or fewer) reviews it has than you, its rating and whether it uses different categories. Gap analysis sums up what separates you.
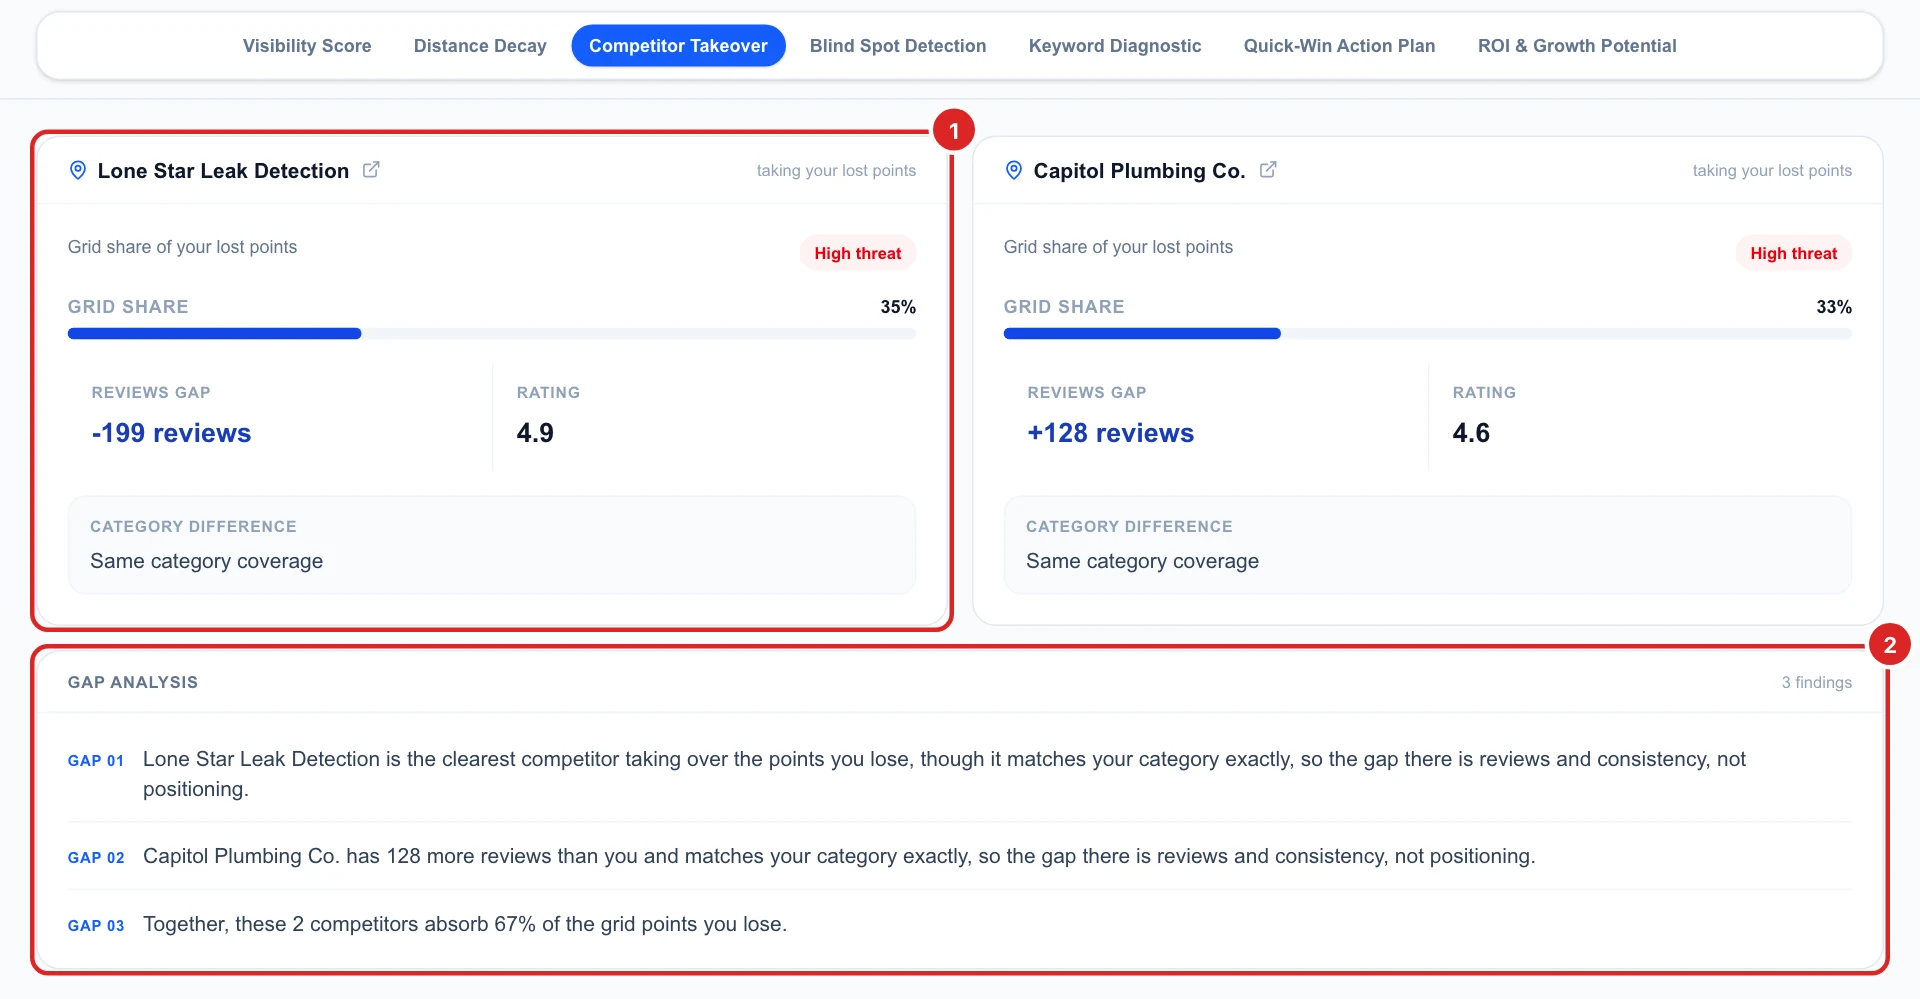
Spot your easiest wins
Blind Spot Detection finds the parts of the map where you rank 4 to 10: close to the map pack, so the cheapest to win. It shows how many such points there are, which sector is the fastest win, and a card per sector with your average rank there, why it is an opportunity, and the effort and impact of going after it.
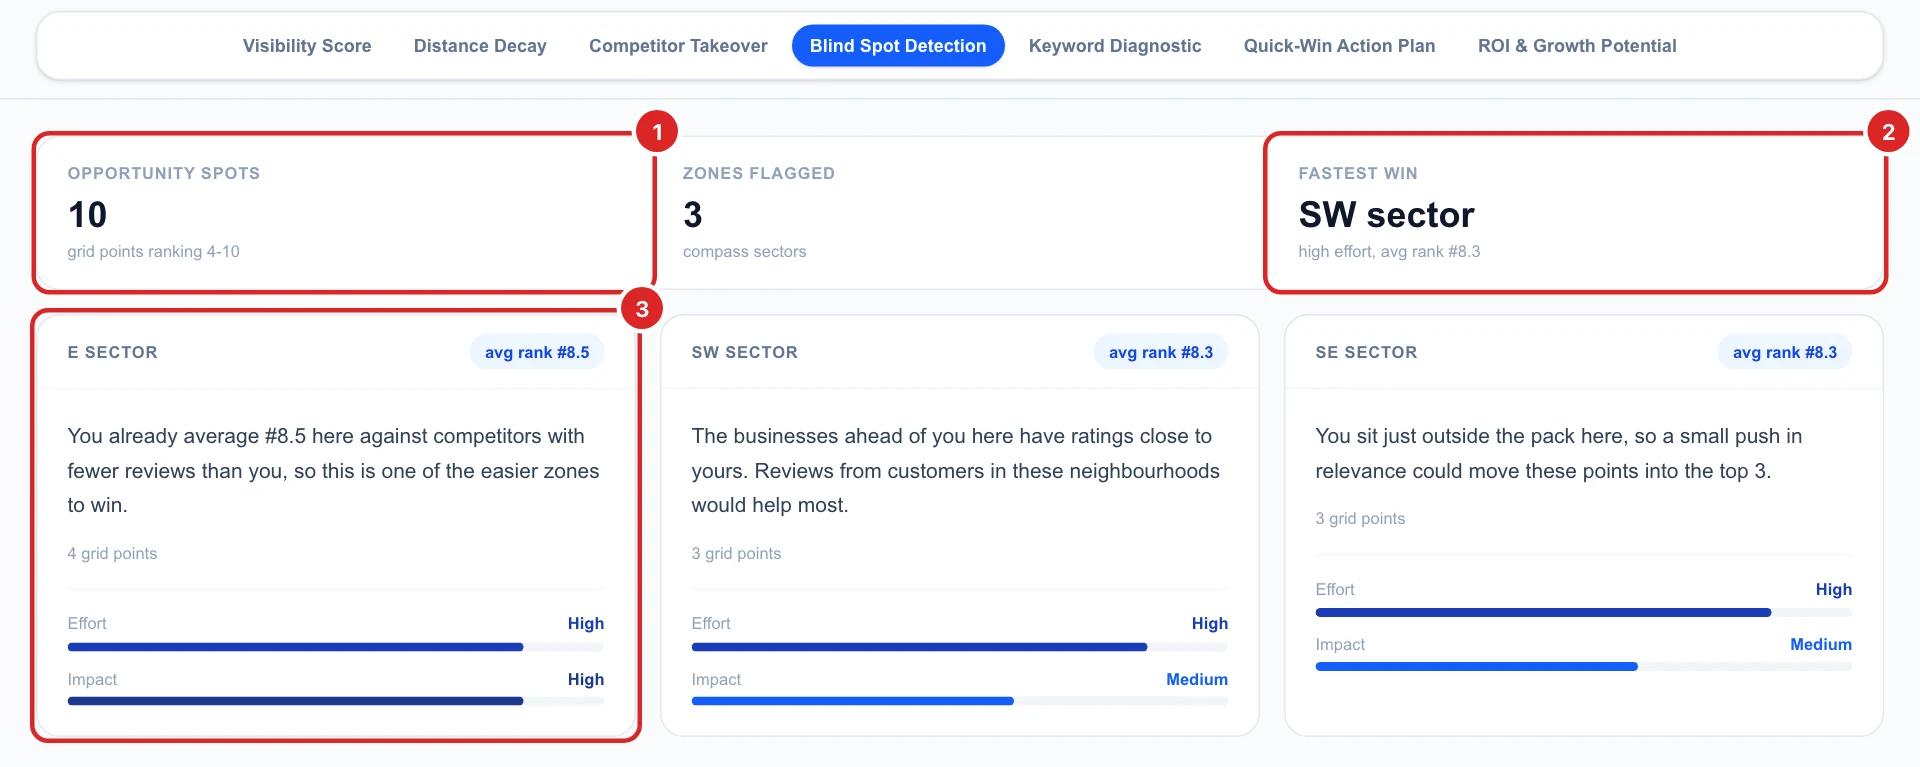
Check how well you fit the keyword
Keyword Diagnostic judges how well your Google listing matches the search:
- Keyword fit: a short verdict and why, with a health score.
- Audit matrix: four parts of your listing (business title, primary category, services list, reviews), each marked optimized or a keyword gap, with its impact.
- The missing pieces and one concrete recommendation.
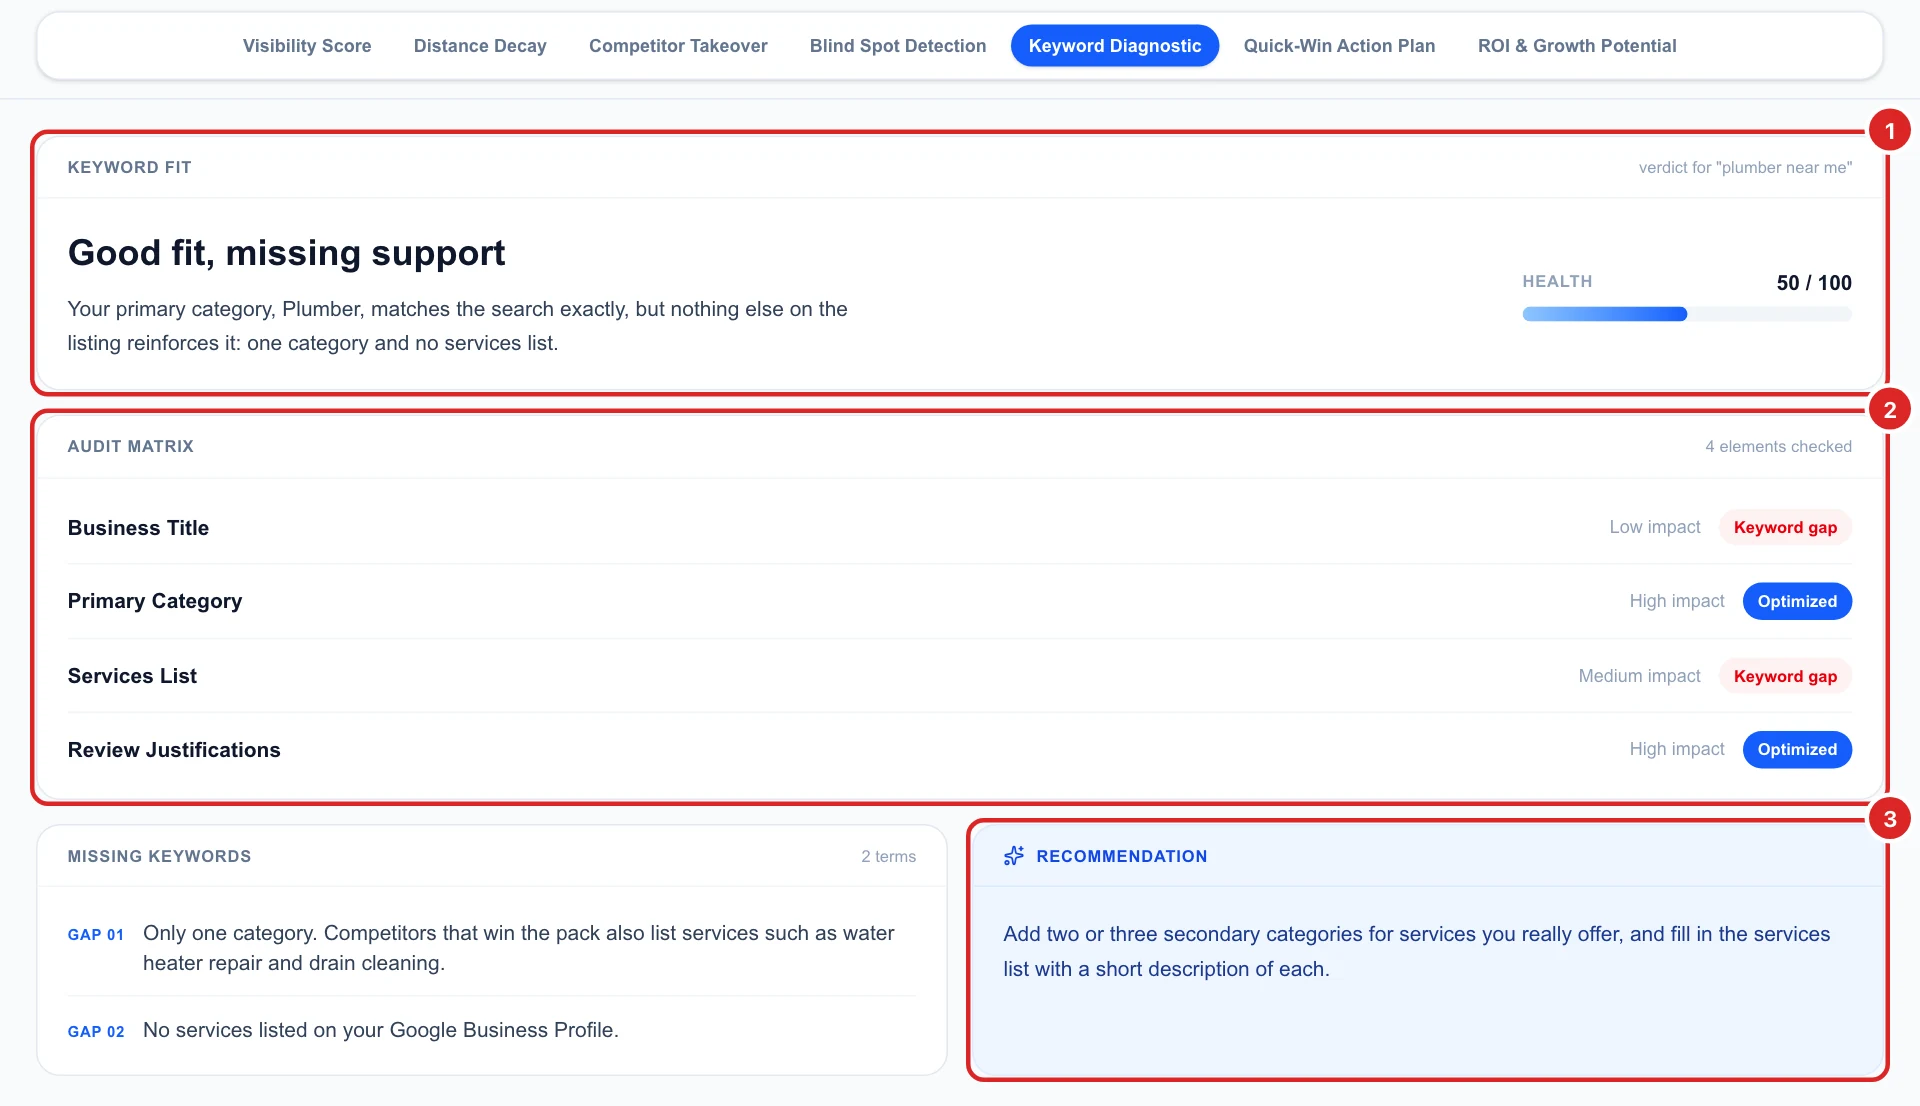
A keyword gap on the business title does not mean you should add keywords to your name. Google’s guidelines require your real business name, and stuffing it can get a listing suspended. Close the gap with categories, services and reviews instead.
Follow the action plan
Quick-Win Action Plan lists five concrete steps for this business and keyword, with how many are high impact and the total time they take. Each step says what to do, why (based on your scan), what kind of work it is (profile, reviews, content), its impact and an estimate of the minutes it takes. Start at the top.
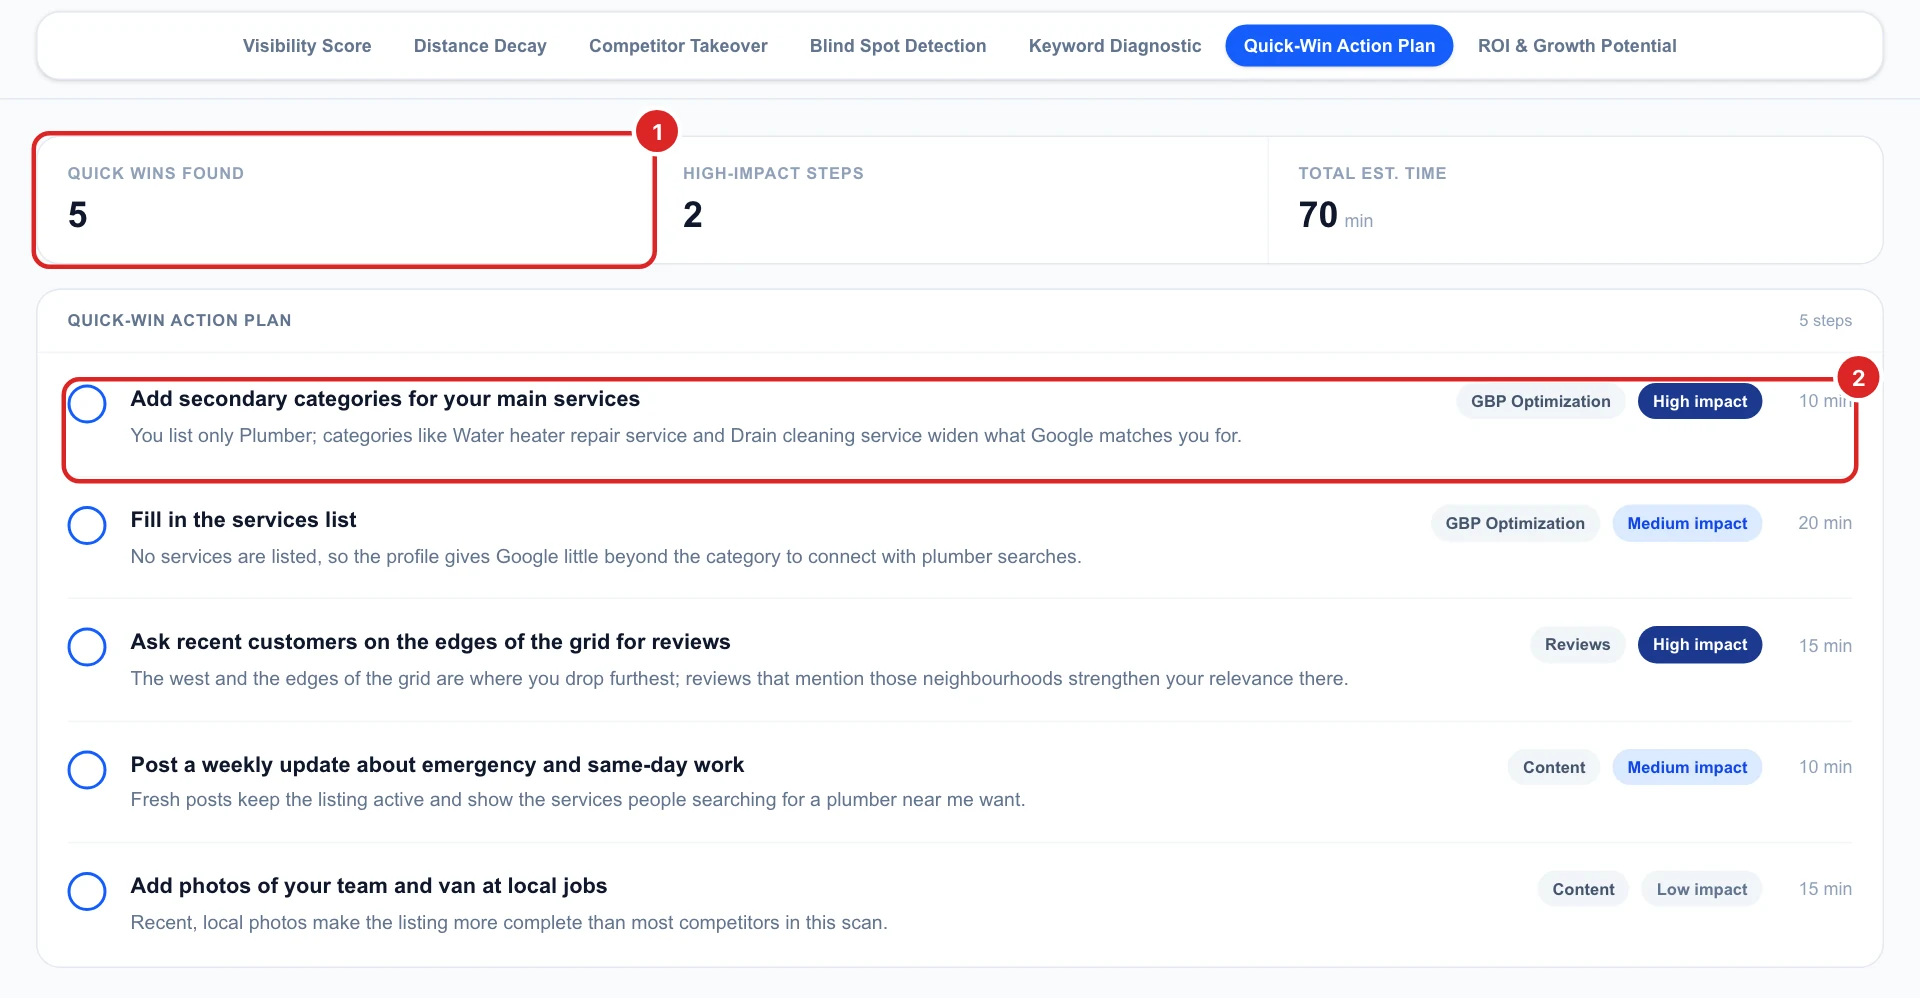
See what moving up could be worth
ROI & Growth Potential shows your current share of top-3 spots next to what it would be if every point where you rank 4 to 8 moved into the top 3, then turns that into projected monthly calls, direction requests and site visits, with a short written estimate.
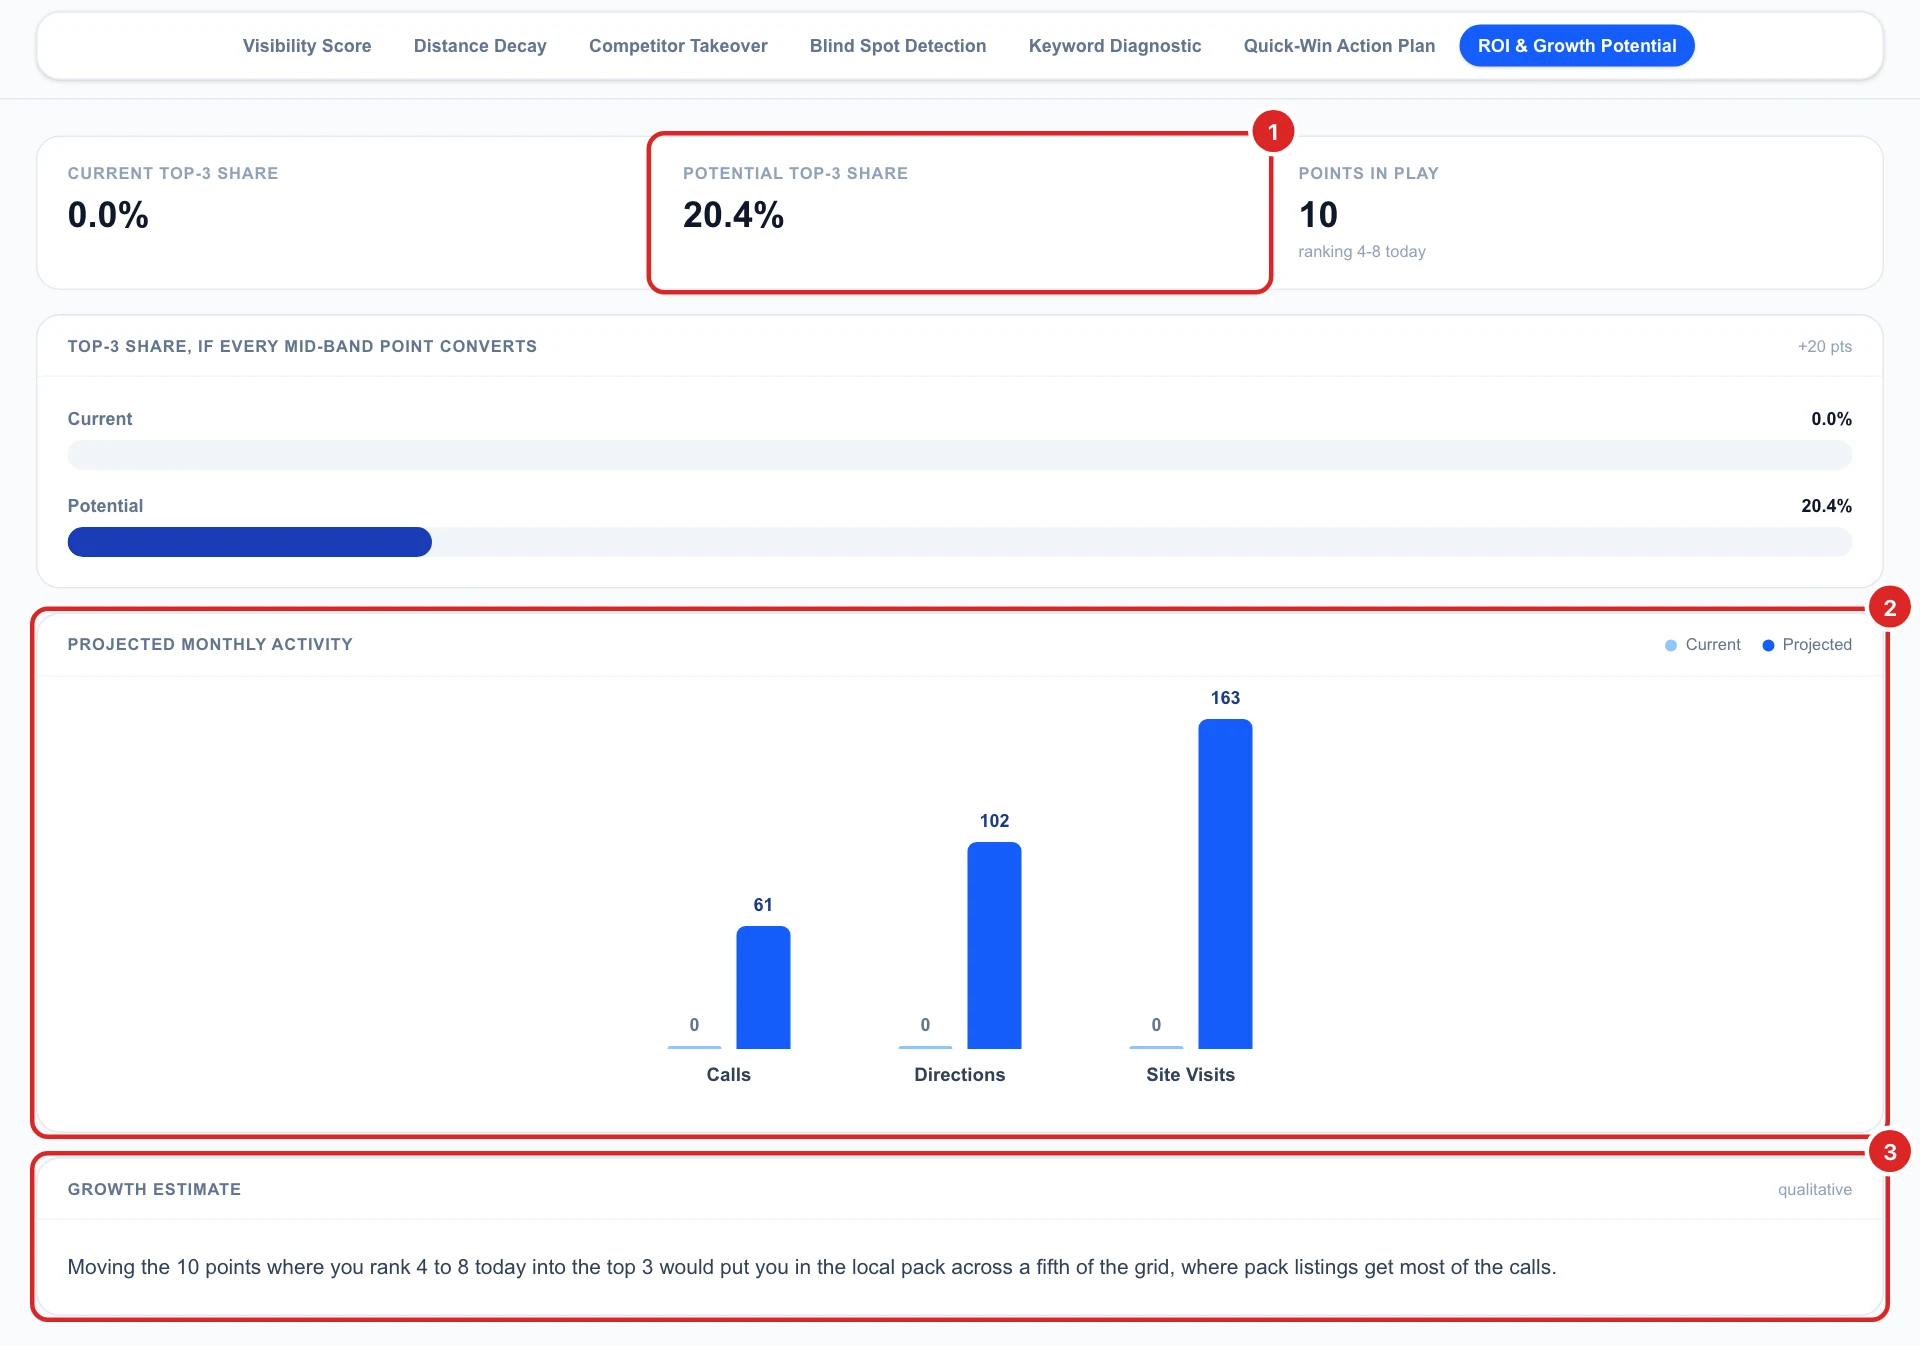
The activity numbers are estimates based on typical local pack behaviour, not a promise. Use them to compare opportunities, and track the real effect with a new scan.
Export the analysis
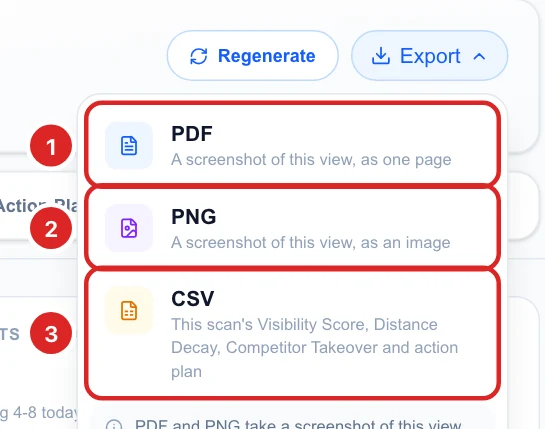
Click Export to download the section you are viewing as a PDF or a PNG image, or the whole analysis as a CSV file, one row per section.
Every analysis you generate is also listed under AI Analysis in the left sidebar. Open one from there, or select several to regenerate or delete them together. Deleting removes only the written analysis; the scan stays in Scan history.
Decide what to do next
- Work through the Quick-Win Action Plan first: it is already sorted for your business.
- Use Blind Spot Detection to choose where to focus reviews, posts and local pages: the fastest-win sector first.
- Compare yourself with the competitors in Competitor Takeover on Google Maps, and see their full map in the Leaderboard tab.
- After a few weeks of changes, run the scan again and generate a new analysis to see what moved.